

Abstract
Surface ozone is an important pollutant causing damage to human health and ecosystems. Here, we find that the Arctic surface ozone during the 2020–2021 winter was evidently enhanced after the sudden stratospheric warming (SSW) onset based on reanalysis data and simulations of a state-of-the-art chemistry-climate model. Further analysis suggests that this enhancement of Arctic surface ozone is primarily a result of the strengthening of the stratosphere-to-troposphere transport associated with the SSW. It is found that the SSW leads to more ozone in the Arctic stratosphere and enhanced downward transport with SSW-related downdraft. The 2021 SSW may also lead to positive anomalies in surface ozone in the northern midlatitudes, which are associated with cold air outbreaks. Our results indicate that the SSW not only affects the weather and climate in the troposphere but may also affect the surface air quality.
Export citation and abstract BibTeX RIS

Original content from this work may be used under the terms of the Creative Commons Attribution 4.0 license. Any further distribution of this work must maintain attribution to the author(s) and the title of the work, journal citation and DOI.
1. Introduction
Most atmospheric ozone is concentrated in the stratosphere, which protects humans and ecosystems from the sun's harmful ultraviolet radiation (McKenzie et al 2011). However, ground-level ozone is an important component of air pollution causing severe effects on human health (Gaudel et al 2018), agricultural production (Fowler et al 2009) and the land-carbon sink (Sitch et al 2007). Because of little human activity, surface ozone is mostly determined by natural processes, horizontal transport from lower latitudes and downward transport from the stratosphere (Helmig et al 2007) in the Arctic. The stratosphere-to-troposphere transport of ozone-rich air, which is associated with the downward branch of stratospheric Brewer–Dobson circulation (BDC), acts as an important source of the Arctic surface ozone especially during winter and spring (Stohl et al 2003, Salby and Callaghan 2006, Liang et al 2009, Butchart 2014).
Sudden stratospheric warming (SSW) events are dramatic temperature increases in the polar stratosphere during winter, which mainly occur in the Arctic. During an SSW event, the stratospheric polar vortex is severely disrupted and the polar night jet is decelerated in most of the polar stratosphere, accompanied by rapid descent and warming of air by several tens of degrees in a few days (Schoeberl 1978, Baldwin et al 2021). The large temperature and wind anomalies associated with SSWs are found to descend from the stratosphere to the troposphere and may be used as a predictor of tropospheric weather regimes (Baldwin and Dunkerton 2001). Previous studies have found that SSW events lead to shifts of the westerly jet and storm tracks (Afargan-Gerstman and Domeisen 2020) and an elevated risk of cold air outbreaks over North America and Eurasia for days to weeks (Kolstad et al 2010, Butler et al 2017, Kretschmer et al 2018). In addition, the enhanced planetary-scale waves propagating up from the troposphere that drive the SSW events accelerate the BDC (Haynes et al 1991, Sjoberg and Birner 2014). As mentioned above, the changes of BDC may influence the Arctic surface ozone during winter. However, the impact of SSWs on the Arctic surface ozone has not received enough attention.
The efficiency of stratosphere-to-troposphere transport in the Arctic is linked to the amount of ozone in the lowermost stratosphere available for transport and the downdraft associated with the strength of the BDC (Griffiths et al 2021). The SSW causes the enhancement of the BDC and weakening of the stratospheric polar vortex (Butler et al 2017, Xia et al 2021), which results in increased stratospheric ozone over the polar cap due to the enhanced transport of surrounding ozone-rich air into the Arctic and weakened chemical loss. This implies that SSW events may enhance stratosphere-to-troposphere transport and lead to more surface ozone over the Arctic.
It is interesting to note that the most recent major SSW occurred on 5 January 2021, which was followed by cold anomalies over the North Eurasian continent and the record-breaking cold in North America in February 2021 (Lee 2021, Lu et al 2021, Davis et al 2022). Here, we provide an evaluation of the impact of the January 2021 SSW on surface ozone using reanalysis data and simulations of a state-of-the-art chemistry-climate model. The following sections describe the data, methods and results.
2. Data and methods
To investigate the impact of the January 2021 SSW on the surface ozone, we use the monthly mean surface air temperature and near-surface ozone at 925 hPa from the fifth generation ECMWF (ERA5) reanalysis (Hersbach et al 2020) during the period 1979–2021 and the Modern Era Retrospective Analysis for Research and Applications version 2 (MERRA-2) reanalysis during 1980–2021. The ERA5 reanalysis has a horizontal resolution of 0.25° × 0.25°. The MERRA-2 reanalysis was generated by the Goddard Earth Observing System (GEOS) model version 5 provided by the Global Modeling and Assimilation Office (GMAO) at the National Aeronautics and Space (NASA) Administration Goddard Space Flight Center (Gelaro et al 2017). The horizontal resolution of the MERRA-2 reanalysis is 0.5° × 0.625°. Linear trends for each calendar month are removed to eliminate long-term changes in surface temperature and ozone for both ERA5 and MERRA-2. The anomalies are computed by the difference between the year 2021 and climatological mean over 1979–2020 (1980–2020) in ERA5 (MERRA-2) in January and February after the onset of the major SSW on 5 January 2021.
To further verify the impact of the January 2021 SSW and the contributions from it, we use chemical simulations of the specified dynamical version of the Whole Atmosphere Community Climate Model version 6 (WACCM6) (Gettelman et al 2019), compiled from the Community Earth System Model Version 2 developed by the National Center for Atmospheric Research (NCAR) (Danabasoglu et al 2020). Here, the WACCM6 is driven by meteorological fields from the GEOS model provided by the GMAO at the NASA Administration Goddard Space Flight Center. The simulations use anthropogenic emissions from the latest Copernicus Atmosphere Monitoring Service inventory. Open fire emissions are from the Fire INventory from NCAR version 1.0 (Wiedinmyer et al 2011). The WACCM6 is configured at 0.9° × 1.25° horizontal resolution with 88 vertical levels. The model domain extends from the Earth's surface to the lower thermosphere (∼140 km or 5.96 × 10⁻⁶ hPa). WACCM has been widely used in previous studies on the stratosphere-to-troposphere transport of ozone (Hess et al 2015, Yang et al 2016, Abalos et al 2020, Albers et al 2022).
Chemical simulations of WACCM6 are performed by NCAR and available from 20 August 2019 until 2 weeks ago (www.acom.ucar.edu/waccm/download.shtml). Note that the chemical output of WACCM includes a stratospheric ozone tracer (O3S) that evolves via full chemistry in the stratosphere and then decays at a tropospheric chemistry rate once it crosses the tropopause. In the troposphere, O3S experiences the same loss rate as O3 in the troposphere but is not affected by NOx photolysis as defined by the Chemistry-Climate Model Initiative (Tilmes et al 2016, Wang et al 2020). In general, O3S is a good indicator of stratosphere-to-troposphere transport. The tropospheric ozone in WACCM6 has been found to be in good agreement with ozonesondes and airborne data and generally captures observed abundances around the globe to within 25% (Emmons et al 2020).
In this study, we use the 6-hourly outputs of temperature, wind, O3 and O3S during the 2019–2020 and 2020–2021 winters. Because there is no high-temporal-resolution vertical velocity in the output of WACCM, we use the 3-hourly vertical pressure velocity from the MERRA-2 reanalysis (https://gmao.gsfc.nasa.gov/reanalysis/MERRA-2/).
In comparison to the weak stratospheric polar vortex during the 2020–2021 winter, the 2019–2020 winter experienced a strong polar vortex, which provides a necessary condition for the severe ozone depletion during spring 2020 (Xia et al 2021). Since stratosphere-to-troposphere transport is the major source of Arctic surface ozone during polar nights, we can simply assess the impact of the January 2021 SSW on the Arctic surface ozone by comparing the two winters. The polar cap average is the 60°–90° N average weighted by the cosine of latitude.
3. Results
Figure 1 shows the anomalies in surface temperature and near-surface ozone at 925 hPa in January and February 2021 compared to the climatological mean over 1979–2020 in the ERA5 reanalysis. It is found that the 2021 SSW leads to surface cooling in North Eurasia in January and in both North Eurasia and North America in February (figures 1(a) and (b)), which is consistent with the results of previous studies (Lee 2021, Lu et al 2021, Davis et al 2022). An increase in ground-level ozone occurred in the northern midlatitudes and the Arctic following the 2021 SSW (figures 1(c) and (d)). It is interesting to note that the increase in surface ozone has a similar spatial pattern to that of surface cooling. The positive anomalies of near-surface ozone in North Eurasia can reach about 7.2 and 5.2 ppbv in January and February 2021, respectively. Cold air outbreaks in western North America were also associated with an increase in ground-level ozone in February 2021 with a maximum of about 4.9 ppbv. Similar results can also be seen in the MERRA-2 reanalysis except that the enhancement of surface ozone over the Arctic is stronger (figure S1). We find that the polar vortex is displaced from the North Pole by the 2021 SSW and shifted to North Eurasia in January and western North America in February (figures S2(a)–(d)). The weakened polar vortex extended from the stratosphere to the troposphere (figures S2(e)–(h)), which is consistent with Baldwin and Dunkerton (2001). Previous studies have shown that geopotential height and ozone anomalies should be anticorrelated for medium-scale waves due to vertical motion and horizontal advection (Schoeberl and Krueger 1983, Salby and Callaghan 1993), which can further influence the stratosphere-to-troposphere transport (Albers et al 2022). Thus, the increase in ground-level ozone in North Eurasia and western North America may be related to the 2021 SSW of the vortex displacement type. Our results suggest that the 2021 SSW may lead to positive anomalies in surface ozone in the Arctic and northern midlatitudes.
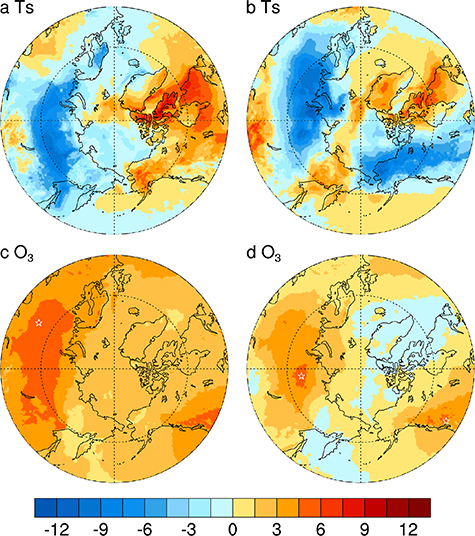
Figure 1. Geographic distributions of the anomalies in surface (a), (b) temperature (unit: K) and (c), (d) near-surface O3 (unit: ppbv) at 925 hPa in (a) and (c) January and (b) and (d) February 2021 compared to the climatological mean over 1979–2020 in the ERA5 reanalysis. White stars mark the location of local maximum ozone increases.
Download figure:
Standard image High-resolution imageIn order to investigate the contribution of stratosphere-to-troposphere transport to the enhancement of surface ozone associated with the 2021 SSW, the WACCM6 simulations are analyzed in the following. Figure 2 shows the time series of Arctic stratospheric meteorological variables and associated surface O3S and ozone during the 2020–2021 winter and 2019–2020 winter in WACCM6. During the 2020–2021 winter, the Arctic stratospheric temperature at 10 hPa increased by about 27 K in late December and early January (figure 2(a)). At the same time, the zonal-mean westerly wind at 10 hPa and 60° N rapidly decreased to about −8 m s−1 (figure 2(b)), which represents a weakening of the stratospheric polar vortex. The reversal of the zonal-mean zonal wind at 10 hPa and 60° N indicates the onset of the major SSW on 5 January 2021, applying the criterion of Charlton and Polvani (2007). In contrast, the Arctic stratospheric temperature remained relatively low at 10 hPa during the 2019–2020 winter. The zonal-mean westerly wind at 10 hPa and 60° N during the 2019–2020 winter, which fluctuated around 40 m s−1, was generally stronger than that in the 2020–2021 winter. This indicates that the stratospheric polar vortex was much weaker in the 2020–2021 winter especially after the January 2021 SSW onset.

Figure 2. Time series of 6-hourly Arctic stratospheric meteorological variables and associated surface O3S and ozone during the 2020–2021 winter (red lines) and the 2019–2020 winter (blue lines) in WACCM6. (a) Air temperature at 10 hPa averaged over the Arctic, (b) zonal-mean zonal wind at 10 hPa and 60° N, (c) surface O3S averaged over the Arctic and (d) surface ozone averaged over the Arctic. Black thin line indicates the onset of the major SSW on 5 January 2021.
Download figure:
Standard image High-resolution imageChanges in the strength of the stratospheric polar vortex may impact the stratosphere-to-troposphere transport and further influence the Arctic surface ozone. Figures 2(c) and (d) show the time series of the polar-average surface O3S and surface ozone in the two winters. The polar-mean surface O3S and ozone generally increased with time during both winters. It is found that the Arctic surface ozone is positively correlated with the surface O3S. The correlation coefficients can reach about 0.99 and 0.93 during the 2020–2021 winter and 2019–2020 winter, respectively, which indicates that the variations of the Arctic surface ozone may be closely related to the stratosphere-to-troposphere transport in winter. It is interesting to note that the polar-mean surface O3S during the 2020–2021 winter is close to that in the 2019–2020 winter before the onset of the SSW and larger than the 2019–2020 winter after the onset (figure 2(c)), which can also be seen in the variations of the Arctic surface ozone (figure 2(d)). This indicates that the January 2021 SSW likely leads to stronger stratospheric intrusion and consequently more surface ozone. The differences increase gradually after the onset of the SSW and reach their maximum in mid-February, which is about 4.1 and 5.0 ppbv for the surface O3S and ozone, respectively. Compared to the 2019–2020 winter, the fractional increases of the surface O3S and ozone can reach about 14.7% and 11.3% during the 2020–2021 winter, respectively.
Figure 3 shows the time-height evolutions of the differences in the Arctic temperature, zonal wind, vertical pressure velocity and O3S between the 2020–2021 and 2019–2020 winters in WACCM6. We find that the warm anomalies, which occurred in the upper stratosphere in late December, descended into the lowermost stratosphere in a few days and persisted for 2 months (figure 3(a)). Similarly, the negative anomalies of zonal wind descended from the upper stratosphere to the lowermost stratosphere in late December and early January (figure 3(b)). The anomalies of stratospheric temperature and circulation were further propagated downward to the troposphere and impacted surface weather in the following 2 months after the SSW onset, which is consistent with previous studies (Baldwin and Dunkerton 2001, Hu and Xia 2013, Baldwin et al 2021, Lu et al 2021). Associated with the SSW onset, positive (downdraft) anomalies of vertical pressure velocity occurred in the lower stratosphere and troposphere and persisted for around 2 months (figure 3(c)). The downdraft anomalies during the occurrence of the SSW are related to the accelerated BDC due to the enhanced planetary-scale waves propagating into the stratosphere from the troposphere that drives the SSW. In the following 1–2 months after the SSW onset, strong upward wave activity flux was reflected downward by the negative zonal winds and converged in the tropopause region (Thompson et al 2006, Davis et al 2022), which resulted in a poleward residual circulation in the troposphere and consequent downdraft anomalies over the Arctic according to the 'downward control' theory (Haynes et al 1991). Interestingly, the SSW weakened the stratospheric polar vortex and allowed poleward transport of ozone-rich midlatitude air and led to more stratospheric ozone above 300 hPa over the Arctic (figure 3(d)). Both the enhanced downdraft and more stratospheric ozone result in the strengthening of the stratosphere-to-troposphere transport of ozone after the SSW onset. Further analysis shows that the enhancement of the downdraft plays a major role in the strengthening of the downward ozone mass flux from the stratosphere to the troposphere after the SSW onset (figure S3). Compared to the 2019–2020 winter, both the frequency and strength of the ozone downward transport are enhanced during the 2020–2021 winter. The maximum of the downward ozone mass flux with a value of 111.4 Tg s−1 occurred on 9 February 2021.
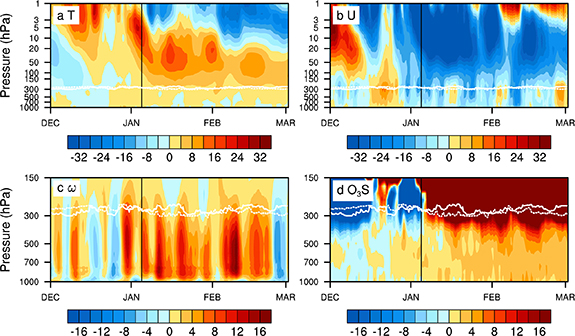
Figure 3. Time-height development of the differences of polar cap average of (a) temperature (unit: K), (b) zonal wind (unit: m s−1), (c) vertical pressure velocity (ω, unit: hPa d−1) and (d) O3S (unit: ppbv) between the 2020–2021 and 2019–2020 winters in WACCM6. Black thin line indicates the onset of the major SSW on 5 January 2021. White solid/dotted lines indicate the tropopause in the 2019–2020/2020–2021 winter.
Download figure:
Standard image High-resolution imageFigure 4 shows the latitude-height sections of the differences of zonal mean temperature, zonal wind, O3S and ozone between the 2020–2021 and 2019–2020 winters averaged over 5 January–28 February in WACCM6. By comparison to the 2019–2020 winter, it is found that the January 2021 SSW led to the Arctic stratospheric warming and deceleration of the polar night jet in the following 2 months after the SSW onset (figures 4(a) and (b)). The positive ozone anomalies in the lowermost stratosphere can be transported into the troposphere by the anomalous downdraft over the Arctic (figure 4(c)). It is also worth noting that a poleward residual circulation occurred in the troposphere poleward of 50° N, which consists of ascending anomalies over 50°–60° N and descending anomalies in the Arctic. Thus, the stratosphere-to-troposphere transport is much weaker in the lower latitudes over 50°–60° N than that in the Arctic. Furthermore, the stratosphere-to-troposphere transport over 30°–50° N, which is associated with tropopause folds, was also enhanced due to the local strengthening of the subtropical jet. The variation of the tropospheric ozone is closely related to the variation of the O3S (figure 4(d)). The spatial correlation coefficient between the tropospheric ozone and O3S is almost 1.0, which indicates that the stratosphere-to-troposphere transport is an important source of tropospheric ozone during winter especially in the Arctic. It is interesting to note that the positive tropospheric ozone anomalies over the Arctic are likely further transported southward to the midlatitudes, which can also be seen in the time-latitude evolution of the surface ozone responses (figure S4).
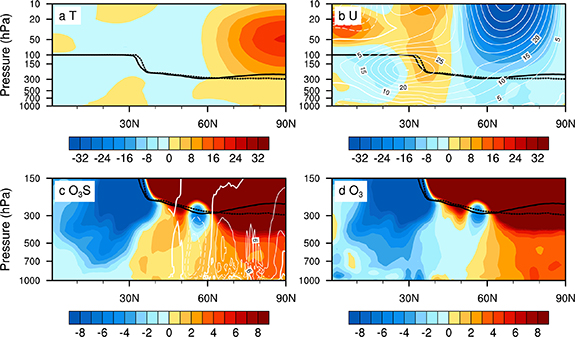
Figure 4. Latitude-height sections of the differences of zonal mean (a) temperature (unit: K), (b) zonal wind (unit: m s−1), (c) O3S (color shading, unit: ppbv) and vertical pressure velocity (white contour lines, unit: hPa d−1) and (d) ozone (unit: ppbv) between the 2020–2021 and 2019–2020 winters averaged over 5 January–28 February in WACCM6. White contours in panel (b) indicate the averaged zonal wind during 5 January 2020–28 February 2020, with contour intervals of 5 m s−1. In panel (c), solid (dashed) contours indicate descending (ascending) motion, with contour intervals of 6 hPa d−1. Black solid/dotted lines indicate the tropopause in the 2019–2020/2020–2021 winter.
Download figure:
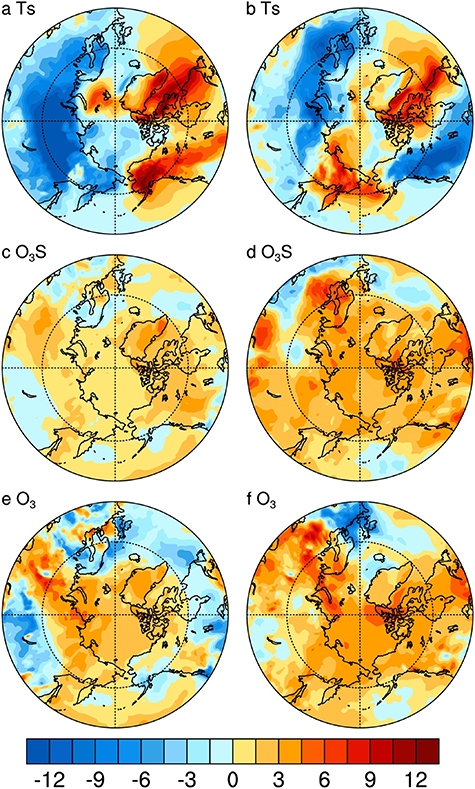
Standard image High-resolution imageAs mentioned in the introduction section, SSW events result in an elevated risk of cold air outbreaks over North America and Eurasia. Figure 5 shows the geographic distributions of the differences in surface temperature, surface O3S and surface ozone between the 2020–2021 and 2019–2020 winters averaged over January and February in WACCM6. In January, the 2021 SSW led to surface warming in the Arctic around Greenland and Alaska and cooling in North Eurasia (figure 5(a)). Accompanied by the changes in surface temperature, the enhanced stratosphere-to-troposphere transport caused more surface O3S in the Arctic, with a maximum value of about 5.6 ppbv (figure 5(c)). The positive anomalies of O3S also occurred in the midlatitudes associated with cold outbreaks especially over Eastern Europe in Russia, where the monthly mean surface O3S and ozone are relatively small (figure S5). The response of the surface ozone is related to changes in surface O3S, with a spatial correlation coefficient of 0.60 in the Arctic (figure 5(e)). It is found that stratosphere-to-troposphere transport may contribute about 76% of the surface ozone increase in the Arctic in January 2021. In February, the surface cooling in North Eurasia weakened and shifted westward (figure 5(b)). Anomalous cold air outbreaks also occurred in North America, which led to record cold in North America in February 2021. The stronger downward transport in February 2021 resulted in more surface O3S in the Arctic with a maximum value of 7.4 ppbv compared to that in January (figure 5(d)). It seems that the increase in surface O3S is not confined to the Arctic, which can extend to the midlatitudes especially over Central Europe and North America where severe surface cooling occurred. We find that the positive anomalies of surface ozone in February mainly occurred in the regions where the stratosphere-to-troposphere transport was enhanced (figures 5(d) and (f)). The Arctic surface ozone increased by 2.9 ppbv, almost all of which can be attributed to the enhancement of stratospheric ozone intrusion.
Figure 5. Geographic distributions of the differences in surface (a), (b) temperature (unit: K), (c), (d) surface O3S (unit: ppbv) and (e), (f) surface ozone (unit: ppbv) between the 2020–2021 and 2019–2020 winters averaged over (a), (c), (e) 5 January–31 January and (b), (d), (f) 1 February–28 February in WACCM6.
Download figure:
Standard image High-resolution image
In WACCM6, we use the simulations of the 2019–2020 winter instead of the climatological average as the control case due to the limitations of the chemical simulations of WACCM6 performed by NCAR, which are only available from 20 August 2019 until 2 weeks ago. During the 2019–2020 winter, the Arctic stratospheric polar vortex was anomalously strong especially during late February (Xia et al 2021). This may lead to an overestimation of the impact of the January 2021 SSW on the Arctic surface ozone, which warrants further investigation in the future. Although the patterns of surface ozone anomalies are different between the reanalysis and simulations (figures 1 and 5), the WACCM6 simulation can also capture the high surface ozone in North Eurasia and western North America, as shown in figure 5.
4. Conclusion and discussion
We investigate the impact of the January 2021 SSW on the Arctic surface ozone using the ERA5 and MERRA-2 reanalysis and chemical simulations of WACCM6. It is found that the SSW results in an enhancement of the Arctic surface ozone in the following 2 months after its onset in both reanalysis data and WACCM6, with maximum fractional increases of about 11.3% in the mid-February in WACCM6. The Arctic surface ozone increase is primarily caused by the strengthening of stratosphere-to-troposphere transport, which is mainly associated with the enhanced downdraft in the lower stratosphere and troposphere. Our results indicate that the positive anomalies in surface ozone also occurred in North Eurasia and western North America associated with cold air outbreaks.
We also find that the January 2021 SSW results in the strengthening of the subtropical jet over 30°–50° N, which enhances the stratosphere-to-troposphere transport associated with tropopause folds in the midlatitudes (figure 4). Previous studies have demonstrated that the response of the subtropical jet to stratospheric perturbation depends on jet latitude (Garfinkel et al 2013) and anomalous weather patterns in the Pacific (Afargan-Gerstman and Domeisen 2020). Thus, the impact of the SSW on the stratospheric ozone intrusions in the midlatitudes still needs further studies.
It is important to note that the influence of the SSW on the surface ozone persists for at least 2 months after the SSW onset. Our results suggest that the occurrence of the SSW is a very good predictor of Arctic surface ozone in the Northern Hemisphere. SSW can influence both surface weather and air quality during winter in the Northern Hemisphere at high latitudes.
Acknowledgments
We thank Dr Jian Yue for helpful comments. This work is supported by the National Key Research and Development Program of China (No. 2022YFF0801701), the National Natural Science Foundation of China, under Grant Nos. 42105016 and 42122037, the Second Tibetan Plateau Scientific Expedition and Research Program (2019QZKK0604) and the Key Laboratory of Middle Atmosphere and Global environment Observation (LAGEO-2022-01). We thank NCAR for providing the WACCM6 simulations. The WACCM6 simulations can be accessed at www.acom.ucar.edu/waccm/download.shtml. The MERRA-2 reanalysis can be found at https://gmao.gsfc.nasa.gov/reanalysis/MERRA-2/. The ERA5 reanalysis can be accessed at https://cds.climate.copernicus.eu/cdsapp#!/search?type=dataset%252526text=ERA5.
Data availability statement
The data that support the findings of this study are openly available at the following URL/DOI: www.acom.ucar.edu/waccm/download.shtml.
Supplementary data (6.1 MB DOCX)